
Reporting dashboards
GoodUp's reporting shows the results of your platform in an easy and accessible way.
Currently, there are 7 reporting dashboards:
- Overview
- Analytics
- Contributions
- Initiatives & Activities
- Members
- Impact Goals
- Activity occupancy
In this article, we will walk you through the different dashboards and explain what you can find on each of them.
If you can’t find the data you are looking for, or are missing specific data, please contact your Customer Success Manager. They’ll be more than happy to discuss the options with you.
The dashboards are accessible at any time for the platform managers in the backoffice of their platform. When you select 'Reporting' in the side navigation, you will see a menu with different reporting dashboards.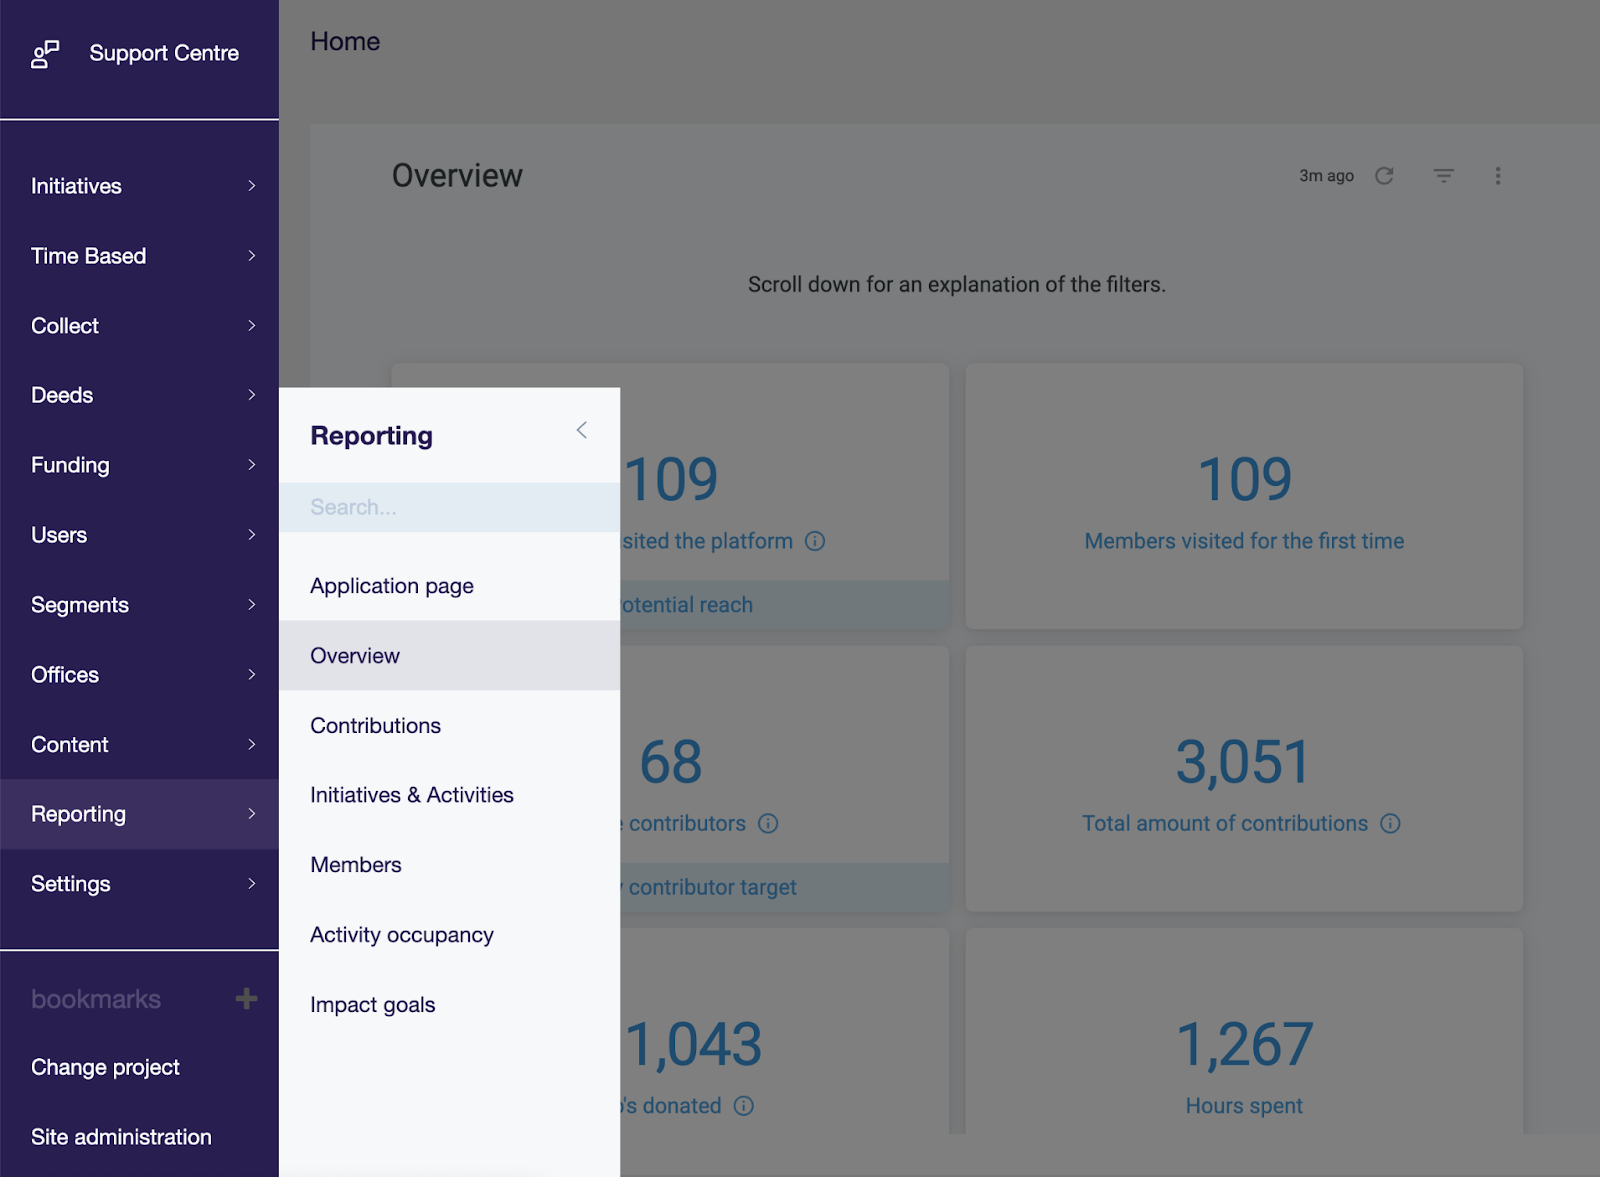
Dashboards
Overview
This dashboard provides your platform's most important metrics over a selected period. It shows key metrics such as the number of members, contributors, and contributions made. By using the dashboard, you get a high-level summary of your platform's performance.
Analytics
This dashboard gives you valuable insights into how the platform is used. Think of unique visitors, total visits (sessions), total page views, views per visit, the bounce rate (the percentage of sessions that had one page view only) and the visit duration. But also insights into how users navigate to your platform and what are the most visited (entry and exit) pages.
Contributions
This dashboard provides an in-depth overview of all data related to contributions on your platform. Each time a user joins, applies, donates to an activity, or creates an activity, one contribution is created. The dashboard allows you to see monthly trends and export all contributions to use in Excel or other tools for your own data analysis.
Members
In depth overview of all data related to members. See monthly trends, and export all members to use in Excel or other tools for your own data analysis.
Initiatives & activities
In depth overview of all data related to initiatives & activities. See monthly trends and, export all initiatives and/or activities to use in Excel or other tools for your own data analysis.
Impact
Overview of your impact goals, the targets you have set and what is realised.
If you are not yet using the feature to track your impact, please reach out to your customer success manager and they will be happy to show you the possibilities.
Activity occupancy
The Activity Occupancy Dashboard displays a list of all activities and their respective availability status. This dashboard provides you with a clear view of how many people have signed up for your activities and how many spots there are still available. This helps you to make informed decisions on which activities to promote, or to increase the number of people who can participate.
How to use the reporting dashboards
Here are some pointers on how to use the reporting dashboards.
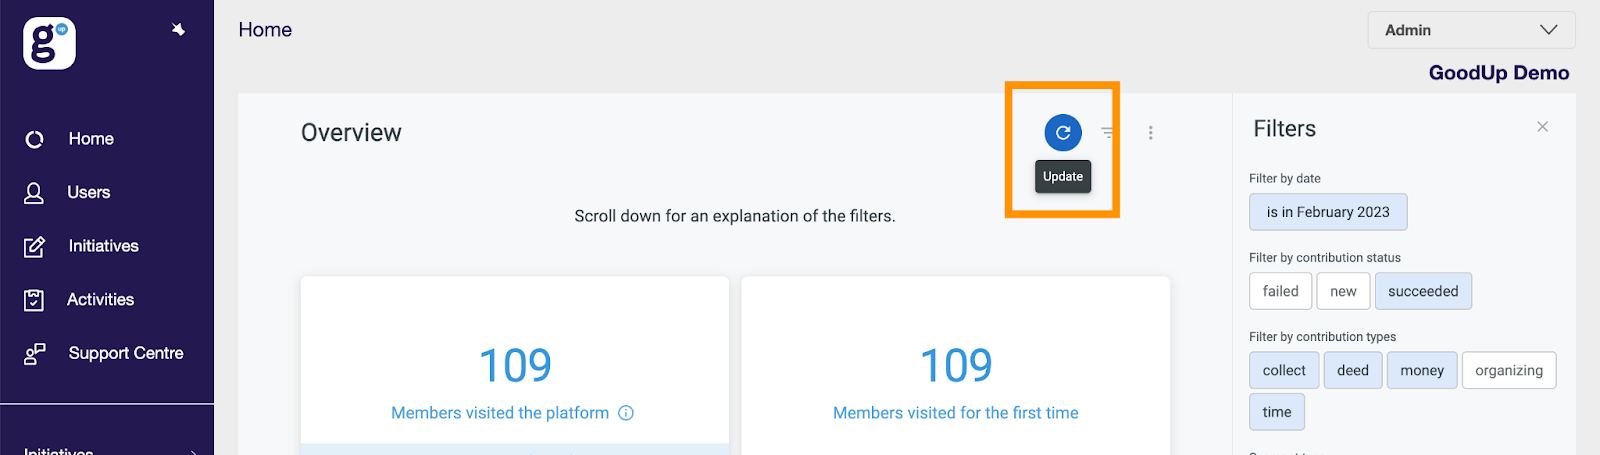
Filters
Each dashboard includes a set of filters to get the right data you are looking for. You can select over which period you want to see data, which contribution types you want to include, and filter on themes, segments and more.
When you've changed the filters, make sure to select the blue reload button to apply them.
Exporting data
Do you want to make an export of your data so you can make your own analyses? Follow these steps to export your data to for example Excel.
You can export your data from the following dashboards: Contributions, Members, Initiatives & Activities. On all these dashboards, you’ll find the export at the bottom of the page. To get there, scroll all the way down the page until the section ‘Export’. Before you start your export, make sure you have set your filters correctly.
To download the export list, select the three dots in the top right corner (they appear when you move your mouse over the table).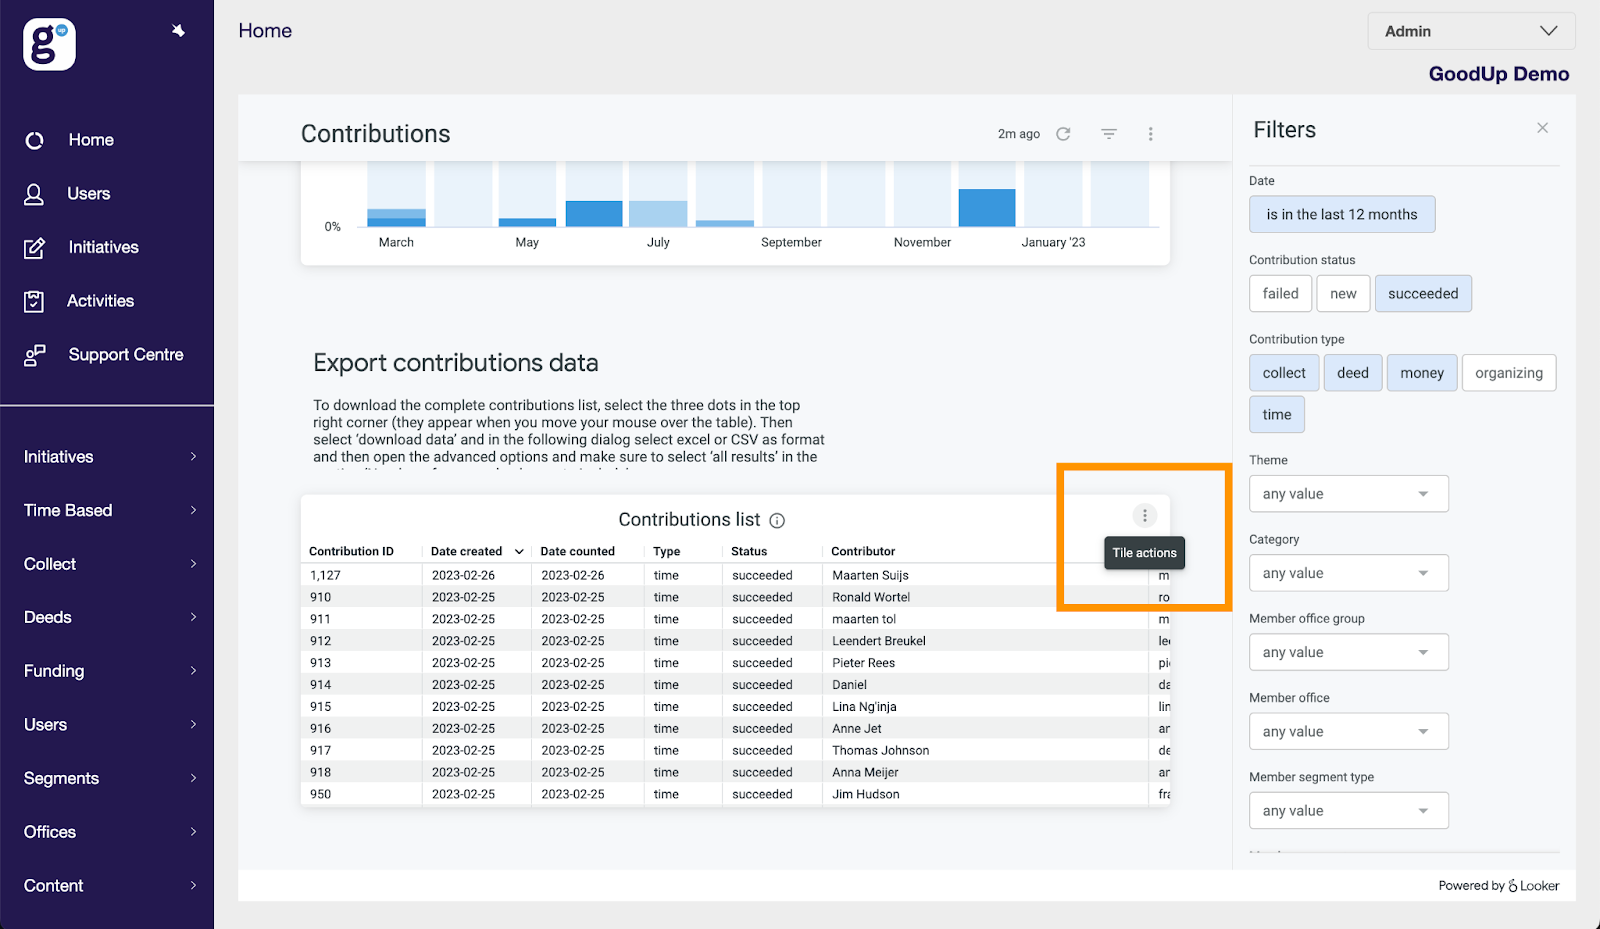
Then select ‘Download data’.
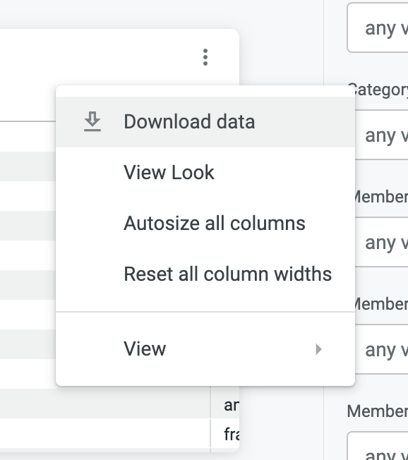
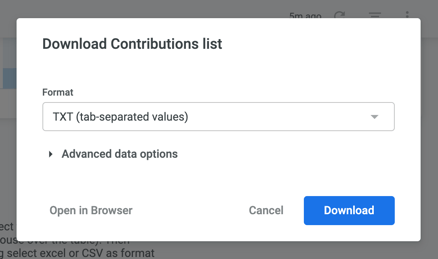
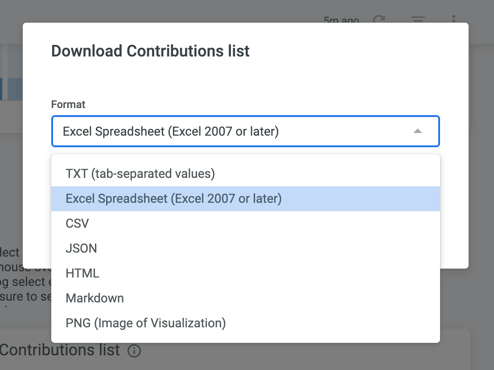
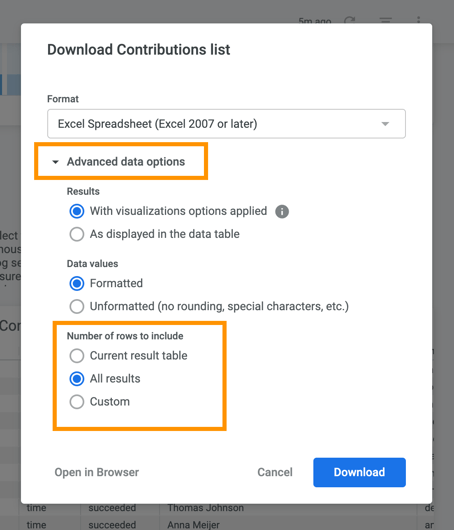
In the following dialog select Excel or CSV as format, and then open the advanced options, and make sure to select ‘all results’ in the section ‘Number of rows and columns to include’.
What do all the definitions in the dashboard mean?
Not sure what certain data mean? Check our list of definitions.
How are contributions counted?
Not sure when or why certain contributions are counted? Check our article on when contributions are counted.